
Carbon credit delivery risk is the chance that a project issues fewer credits than it promised. Across 2,320 registered Gold Standard projects, the median project had been issued 47% of its registered annual estimate for the years covered, and 22% had been issued nothing at all.
Every registered Gold Standard project publishes how many credits it expects each year. Comparing that estimate with what registries have since issued for the same years is the most direct measure of delivery risk available, and almost nobody looks at it. This study does, project by project, and then shows what the result does to the value of a forward offtake agreement.
- Across 2,320 registered Gold Standard projects, the median was issued 47% of its registered estimate for vintages up to 2023. A quarter were issued 5% or less; only 15% delivered 90% or more.
- 22% were issued nothing for the years covered. Of the 375 projects still waiting for their first issuance, 374 had issued nothing.
- Among projects that had issued at least once, the median rose to 61%. The gap is the risk of a project that registers and never issues, which is the risk a forward buyer carries at signing.
- Delivery varies widely: heat-producing biogas projects delivered a median of 86%, domestic energy efficiency 51%, wind 46%, small hydro 5%.
- At the median rate for domestic energy efficiency, prepaying for an eight-year offtake at $18.50 a tonne is only break-even at $6.68 a contracted tonne, with an 8% discount rate.
How delivery was measured
Gold Standard's public registry records each project's estimated annual credits and its crediting period. Berkeley's Voluntary Registry Offsets Database records the credits actually issued to each project, vintage by vintage. The two join through the project's registry identifiers. For each project, the comparison runs as follows:
- Registered projects only. Projects listed but not yet registered are left out, because nothing has been committed.
- A fair window. From the start of the crediting period to its end or to 2023, whichever is earlier. Vintages after 2023 are left out because verification and issuance take time and counting them would understate delivery. The first and last years count only for the part inside the period, and windows shorter than two years are not judged.
- Issued against expected. Credits issued for the vintages in the window, divided by the registered annual estimate over the same years.
- Obvious errors removed. Seven projects issued more than ten times their estimate, which means the estimate was entered wrongly (one is registered at one tonne a year and has issued over two million). They are left out.
The result is a delivery ratio for each of 2,320 projects. Because results are reported as the spread across projects, one very large project cannot move them.
The overall result
| Measure | Result |
|---|---|
| Median project | 47% of its registered estimate issued |
| Lower quartile | 5% or less |
| Upper quartile | 80% or more |
| Issued nothing for the years covered | 22% |
| Delivered 90% or more | 15% |
| Median among projects that had issued | 61% |
| All projects together, by volume | 402 million issued of 918 million expected, 44% |
Measured either way, by the typical project or by total volume, the projects in this record delivered a little under half of what they estimated. That does not mean the credits that were issued are poor. It means a buyer contracting for future credits from a project of this kind should not plan on the estimate.
Projects that never issue
The single largest source of shortfall is projects that register and then issue nothing. Of the 2,320 projects, 518 had been issued no credits for the years covered. 374 of them are projects whose design is certified but which have not yet issued at all, some years into their crediting period. The other 144 had issued at some point, but not for the vintages in the window.
Among the 1,802 projects that had issued for the years covered, the median delivered 61% of its estimate. So there are two risks in one number. The first is whether a project starts issuing at all, and it is concentrated in the early years, which is exactly when forward contracts are signed. The second is how much of its estimate a working project delivers, which is still well short of the estimate for most.
Delivery by project type

| Project type | Projects | Median delivered | Issued nothing | Median, issuing projects |
|---|---|---|---|---|
| Energy efficiency, domestic | 1,215 | 51% | 18% | 60% |
| Wind | 303 | 46% | 19% | 55% |
| Biogas, heat | 192 | 86% | 18% | 86% |
| Solar thermal, electricity | 115 | 47% | 19% | 56% |
| Small, low-impact hydro | 99 | 5% | 48% | 42% |
| Biogas, electricity | 77 | 20% | 36% | 43% |
| Afforestation and reforestation | 49 | 0% | 61% | 48% |
Domestic energy efficiency, mostly clean cooking and household water treatment, dominates the record with 1,215 projects. Its median of 51% is close to the overall figure. Heat-producing biogas stands out at 86%, with almost a third of its projects delivering 90% or more of their estimate. Small hydro and biogas for electricity sit at the other end, with roughly half and a third of projects issuing nothing for the years covered. Afforestation and reforestation projects take years to grow carbon and verify it, and most had not issued for their early vintages, which is why the median is 0% even though those that did issue delivered a median of 48%.
Delivery by country and size
Where at least 40 projects can be compared, delivery also varies by country:
| Country | Projects | Median delivered | Issued nothing |
|---|---|---|---|
| India | 397 | 40% | 24% |
| China | 238 | 71% | 15% |
| Türkiye | 223 | 44% | 23% |
| Uganda | 160 | 40% | 19% |
| Kenya | 140 | 21% | 29% |
| Rwanda | 135 | 62% | 15% |
| Bangladesh | 115 | 60% | 4% |
| Malawi | 78 | 60% | 10% |
| Viet Nam | 58 | 23% | 33% |
| Nigeria | 45 | 81% | 16% |
By size, micro-scale projects delivered a median of 54%, small-scale 40% and large-scale 43%. Differences between countries reflect the mix of project types and developers as much as the country itself, so read a country figure as a base rate for that mix, not a verdict on the country. The host country policy tracker covers the separate question of what governments have done about carbon credits.
Why projects fall short
- Estimates are written early. Developers estimate annual credits at registration, often before the project has run. Optimism is built in.
- Roll-out is slower than planned. Distributing stoves, filters or biogas units to thousands of households takes longer than a project plan assumes.
- Usage drops. Credits for household devices depend on people continuing to use them, which monitoring often finds they do less than expected.
- Verification takes time and money. Small projects may verify several years at once, and some stop paying for verification altogether.
- Some projects never start. Funding falls through, a partner withdraws, or the project is overtaken by events.
What it does to an offtake
An offtake agreement commits a developer to deliver credits each year and a buyer to pay for them. Take a contract for 50,000 tonnes a year from 2027 to 2034 at $18.50 a tonne, with a buyer discount rate of 8%, a replacement price of $22 for any shortfall, and the median delivery rate for domestic energy efficiency, 51.1%.
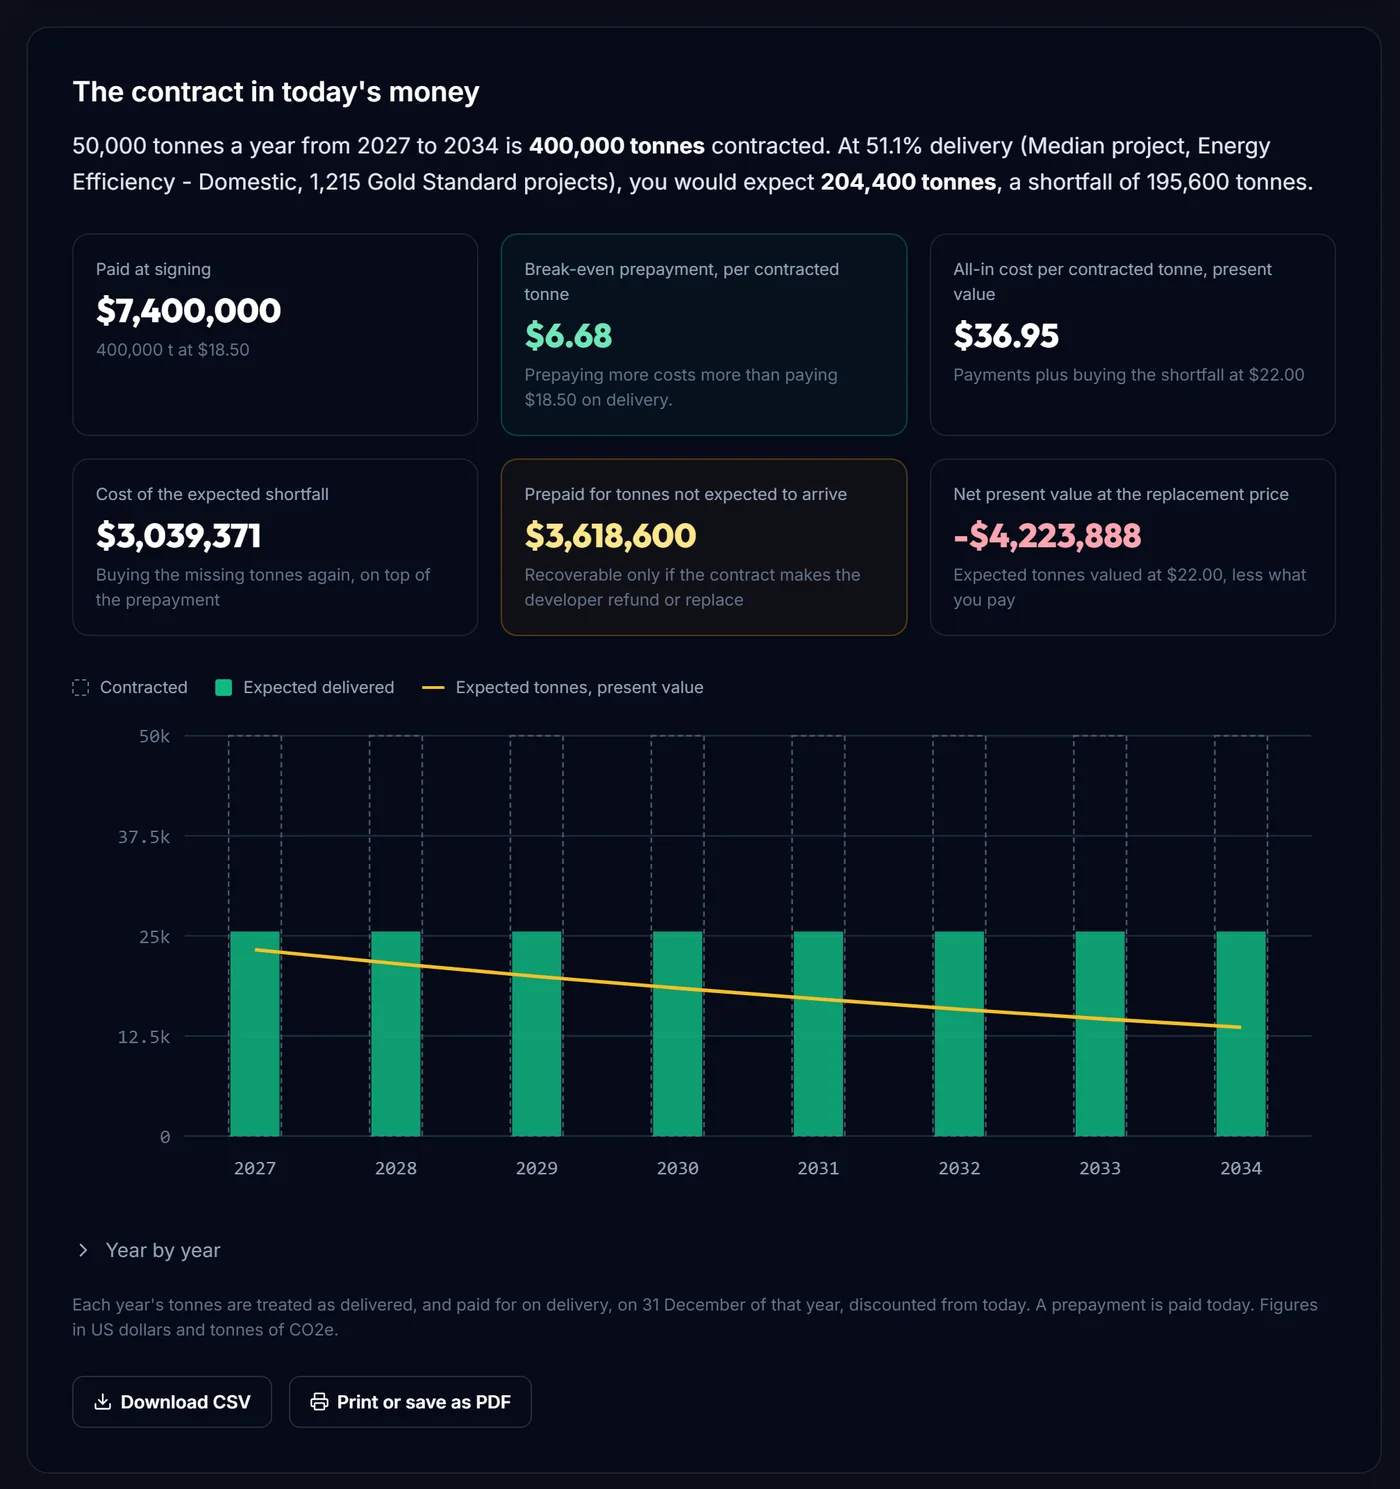
| Result | Pay on delivery | Prepay at signing |
|---|---|---|
| Tonnes contracted / expected | 400,000 / 204,400 | 400,000 / 204,400 |
| Paid, in today's money | $2.67 million | $7.40 million |
| All-in cost per contracted tonne, present value | $20.21 | $36.95 |
| Cost of the expected shortfall | $0.48 million | $3.04 million |
| Prepaid for tonnes not expected to arrive | none | $3.62 million |
The break-even prepayment, the most a buyer could prepay per contracted tonne and be no worse off than paying on delivery, comes to $6.68. With full delivery it would be $13.07, the effect of discounting alone. Delivery risk halves it again. A developer asking for a prepayment much above that is asking the buyer to fund the shortfall.
The Forward Offtake Calculator runs this for any contract, with your own delivery rate or one from this record, and shows the year-by-year table behind it.
Narrow the delivery rate to your deal.
The Offtake Analyzer in the CRBN.credit terminal applies the record for one country and project size, or one project's own record against its estimate, and lists the comparable projects behind the figure.
Using the record in due diligence
- Start from the base rate. Look up the median and lower quartile for the project's type before reading the developer's estimate. If the estimate implies far better delivery than comparable projects achieved, ask why.
- Narrow it. Country and project size change the picture. A group of fewer than 20 comparable projects is too small to quote, so widen the filters rather than trust a handful.
- Read the project's own record. A project that has already issued for several years has a delivery history of its own against its estimate, which is better evidence than any group average. Its issuance by vintage is on its page in the projects database.
- Check where it is in its life. A project whose design is certified but which has not yet issued carries the risk that it never will. Price that separately from the risk of under-delivery once it is running.
- Stress the contract. Run the offtake at the median and at the lower quartile. If the deal only works at the median, it depends on the project doing better than a quarter of its peers.
Contract terms that help
- Pay on delivery where you can. It leaves delivery risk with the party best placed to manage it.
- If you prepay, price the shortfall in. Use a delivery rate from comparable projects, not the estimate, and test the lower quartile as well as the median.
- Make-good clauses. Require the developer to replace undelivered tonnes with credits of similar quality, or refund at a stated price.
- Tranche the payments. Release prepayments against milestones such as validation, first verification and first issuance.
- Check the project, not only the type. Its registry history, methodology status and hazard exposure are on its Credit Passport, and our due diligence checklist covers the rest.
What the record does not show
- It covers Gold Standard only. It is the registry that publishes estimates in a form that can be read in bulk. Delivery on other registries may differ.
- Issuance can catch up. A project behind at the 2023 cut-off may still issue credits for those vintages later.
- Programmes of activities are counted as the registry records them. Where issuance sits under a programme rather than its individual activities, one record can look over-delivered and another under-delivered.
- It says nothing about quality. A project that delivered 100% of its estimate can still have weak additionality or over-crediting. Delivery and quality are separate questions.
Treat the figures as a base rate for a type of project, then look at the project in front of you.
CRBN.credit provides data and research on carbon markets. It does not broker, sell or execute trades in carbon credits, and the calculator is arithmetic, not a price recommendation.
Frequently Asked Questions
How much do carbon projects deliver against their estimates?
Across 2,320 registered Gold Standard projects with a crediting period old enough to judge, the median project had been issued 47% of its registered annual estimate for the years covered. A quarter had been issued 5% or less, and 22% nothing at all.
Why do projects issue less than they estimate?
Developers write their own estimates at registration, often before the project has run. Slower roll-out, lower usage, verification delays, monitoring problems and projects that never start issuing all pull actual issuance below the estimate.
Which project types deliver most reliably?
In this record, heat-producing biogas projects delivered a median of 86% of their estimate. Small hydro delivered a median of 5% and afforestation and reforestation projects a median of 0%, because most of them had not issued for the years covered.
What does delivery risk mean for an offtake agreement?
If you prepay, every tonne that does not arrive is money spent for nothing unless the contract makes the developer refund or replace it. If you pay on delivery, you pay only for tonnes that arrive but must buy any shortfall elsewhere, possibly at a higher price.
What is a break-even prepayment price?
The most you could pay per contracted tonne at signing and be no worse off, in present value, than paying the offered price on delivery. It falls with your discount rate, the length of the contract and the delivery rate you expect.
Where can I calculate this for my own deal?
The Forward Offtake Calculator on CRBN.credit is free and needs no account. The Offtake Analyzer in the terminal narrows the delivery rate to one country, project size or project and lists the comparable projects behind it.
Sources
- Gold Standard, public registry API (estimated annual credits and crediting periods)
- Berkeley Carbon Trading Project, Voluntary Registry Offsets Database, release v2026-06 (credits issued by vintage)
- CRBN.credit, Forward Offtake Calculator and delivery record methodology
A note on this article. Figures cover registered Gold Standard projects with crediting periods old enough to judge, vintages to 2023, as read on 12 October 2026. They update automatically as the registry data does. The worked example is arithmetic on stated assumptions. General information, not investment advice.